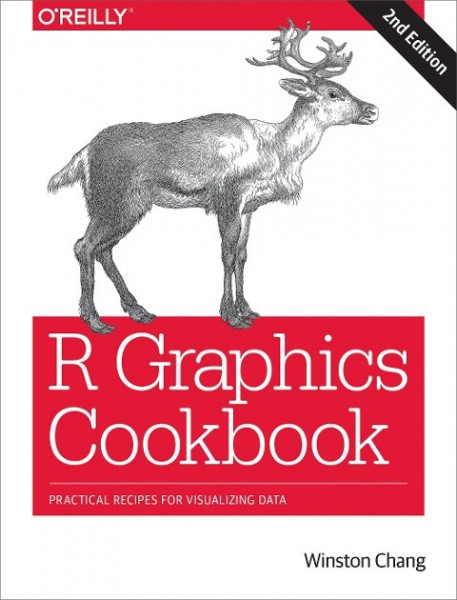
R Graphics Cookbook
Kurzinformation
inkl. MwSt. Versandinformationen
Artikel zZt. nicht lieferbar
Artikel zZt. nicht lieferbar

Beschreibung
This O'Reilly cookbook provides more than 150 recipes to help scientists, engineers, programmers, and data analysts generate high-quality graphs quickly—without having to comb through all the details of R's graphing systems. Each recipe tackles a specific problem with a solution you can apply to your own project and includes a discussion of how and why the recipe works. Most of the recipes in this second edition use the updated version of the ggplot2 package, a powerful and flexible way to make graphs in R. You'll also find expanded content about the visual design of graphics. If you have at least a basic understanding of the R language, you're ready to get started with this easy-to-use reference.Use R's default graphics for quick exploration of dataCreate a variety of bar graphs, line graphs, and scatter plotsSummarize data distributions with histograms, density curves, box plots, and moreProvide annotations to help viewers interpret dataControl the overall appearance of graphicsExplore options for using colors in plotsCreate network graphs, heat maps, and 3D scatter plotsGet your data into shape using packages from the tidyverse von Chang, Winston
Produktdetails

So garantieren wir Dir zu jeder Zeit Premiumqualität.
Über den Autor
Winston Chang is a software engineer at RStudio, where he works on data visualization and software development tools for R. He has a Ph.D. in Psychology from Northwestern University, and created the Cookbook for R website, which contains recipes for common tasks in R.

- paperback
- 154 Seiten
- Erschienen 2017
- CreateSpace Independent Pub...

- Gebunden
- 1051 Seiten
- Erschienen 2012
- Wiley & Sons

- Kartoniert
- 276 Seiten
- Erschienen 2020
- Routledge

- Kartoniert
- 624 Seiten
- Erschienen 2022
- Springer

- Hardcover -
- Erschienen 1992
- Cambridge University Press

- Hardcover
- 405 Seiten
- Erschienen 2010
- John Wiley & Sons Inc
- hardcover
- 632 Seiten
- Erschienen 2009
- Wiley

- Kartoniert
- 496 Seiten
- Erschienen 2019
- Springer Gabler

- paperback
- 593 Seiten
- Erschienen 2020
- Routledge


