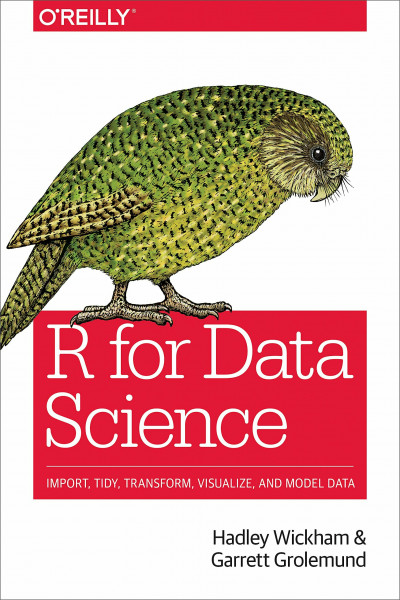
R for Data Science: Import, Tidy, Transform, Visualize, and Model Data
Kurzinformation

inkl. MwSt. Versandinformationen
Artikel zZt. nicht lieferbar

Beschreibung
Learn how to use R to turn raw data into insight, knowledge, and understanding. This book introduces you to R, RStudio, and the tidyverse, a collection of R packages designed to work together to make data science fast, fluent, and fun. Suitable for readers with no previous programming experience, R for Data Science is designed to get you doing data science as quickly as possible. Authors Hadley Wickham and Garrett Grolemund guide you through the steps of importing, wrangling, exploring, and modeling your data and communicating the results. Youâ ll get a complete, big-picture understanding of the data science cycle, along with basic tools you need to manage the details. Each section of the book is paired with exercises to help you practice what youâ ve learned along the way. Youâ ll learn how to: Wrangleâ transform your datasets into a form convenient for analysis Programâ learn powerful R tools for solving data problems with greater clarity and ease Exploreâ examine your data, generate hypotheses, and quickly test them Modelâ provide a low-dimensional summary that captures true "signals" in your dataset Communicateâ learn R Markdown for integrating prose, code, and results
Produktdetails

So garantieren wir Dir zu jeder Zeit Premiumqualität.
Über den Autor
Hadley Wickham is an Assistant Professor and the Dobelman FamilyJunior Chair in Statistics at Rice University. He is an active memberof the R community, has written and contributed to over 30 R packages, and won the John Chambers Award for Statistical Computing for his work developing tools for data reshaping and visualization. His research focuses on how to make data analysis better, faster and easier, with a particular emphasis on the use of visualization to better understand data and models.Garrett Grolemund is a statistician, teacher and R developer who currently works for RStudio. He sees data analysis as a largely untapped fountain of value for both industry and science. Garrett received his Ph.D at Rice University in Hadley Wickham's lab, where his research traced the origins of data analysis as a cognitive process and identified how attentional and epistemological concerns guide every data analysis.Garrett is passionate about helping people avoid the frustration and unnecessary learning he went through while mastering data analysis. Even before he finished his dissertation, he started teaching corporate training in R and data analysis for Revolutions Analytics. He's taught at Google, eBay, Axciom and many other companies, and is currently developing a training curriculum for RStudio that will make useful know-how even more accessible. Outside of teaching, Garrett spends time doing clinical trials research, legal research, and financial analysis. He also develops R software, he's co-authored the lubridate R package--which provides methods to parse, manipulate, and do arithmetic with date-times--and wrote the ggsubplot package, which extends the ggplot2 package.
- Kartoniert
- 207 Seiten
- Erschienen 2009
- Springer
- Kartoniert
- 391 Seiten
- Erschienen 2022
- Springer VS
- paperback
- 154 Seiten
- Erschienen 2017
- CreateSpace Independent Pub...
- paperback
- 420 Seiten
- Erschienen 2020
- Apress
- paperback
- 480 Seiten
- Erschienen 2016
- Wiley
- Kartoniert
- 356 Seiten
- Erschienen 2021
- O'Reilly
- Kartoniert
- 434 Seiten
- Erschienen 2017
- Wiley-VCH
- Kartoniert
- 352 Seiten
- Erschienen 2021
- Pearson Studium
- Kartoniert
- 379 Seiten
- Erschienen 2019
- O'Reilly
- Kartoniert
- 280 Seiten
- Erschienen 2018
- MIT Press
- Kartoniert
- 556 Seiten
- Erschienen 2023
- O'Reilly
- Kartoniert
- 304 Seiten
- Erschienen 2018
- Routledge
- Gebunden
- 360 Seiten
- Erschienen 2021
- Carl Hanser Verlag GmbH & C...
- Gebunden
- 745 Seiten
- Erschienen 2017
- Springer
- Gebunden
- 456 Seiten
- Erschienen 2017
- Springer