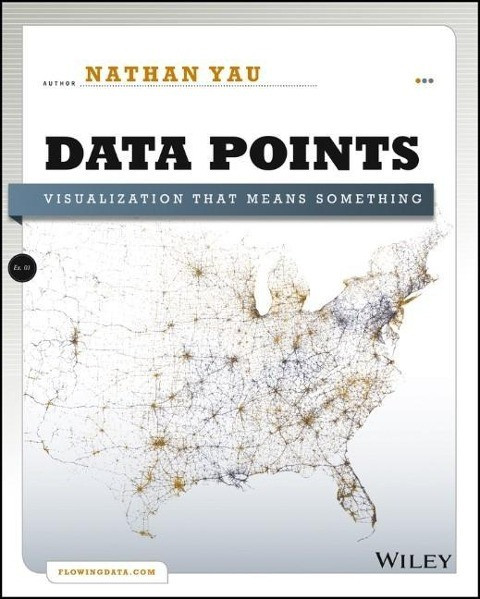
Data Points: Visualization That Means Something
Kurzinformation
inkl. MwSt. Versandinformationen
Artikel zZt. nicht lieferbar
Artikel zZt. nicht lieferbar

Beschreibung
A fresh look at visualization from the author of Visualize This Whether it's statistical charts, geographic maps, or the snappy graphical statistics you see on your favorite news sites, the art of data graphics or visualization is fast becoming a movement of its own. In Data Points: Visualization That Means Something, author Nathan Yau presents an intriguing complement to his bestseller Visualize This, this time focusing on the graphics side of data analysis. Using examples from art, design, business, statistics, cartography, and online media, he explores both standard-and not so standard-concepts and ideas about illustrating data. * Shares intriguing ideas from Nathan Yau, author of Visualize This and creator of flowingdata.com, with over 66,000 subscribers * Focuses on visualization, data graphics that help viewers see trends and patterns they might not otherwise see in a table * Includes examples from the author's own illustrations, as well as from professionals in statistics, art, design, business, computer science, cartography, and more * Examines standard rules across all visualization applications, then explores when and where you can break those rules Create visualizations that register at all levels, with Data Points: Visualization That Means Something. von Yau, Nathan
Produktdetails

So garantieren wir Dir zu jeder Zeit Premiumqualität.
Über den Autor

- paperback
- 154 Seiten
- Erschienen 2017
- CreateSpace Independent Pub...

- Kartoniert
- 157 Seiten
- Erschienen 2021
- Springer Spektrum

- Gebunden
- 448 Seiten
- Erschienen 2019
- Pelican

- Hardcover
- 320 Seiten
- Erschienen 2006
- John Wiley & Sons Inc

- Kartoniert
- 494 Seiten
- Erschienen 2017
- O'Reilly Media

- Kartoniert
- 448 Seiten
- Erschienen 2021
- Basic Books

- Hardcover
- 312 Seiten
- Erschienen 2001
- Springer

- Hardcover
- 100 Seiten
- Erschienen 1981
- Sage Publications, Inc

- Hardcover
- 405 Seiten
- Erschienen 2010
- John Wiley & Sons Inc

- Kartoniert
- 522 Seiten
- Erschienen 2018
- O'Reilly

- paperback
- 277 Seiten
- Erschienen 2006
- MIT Press


