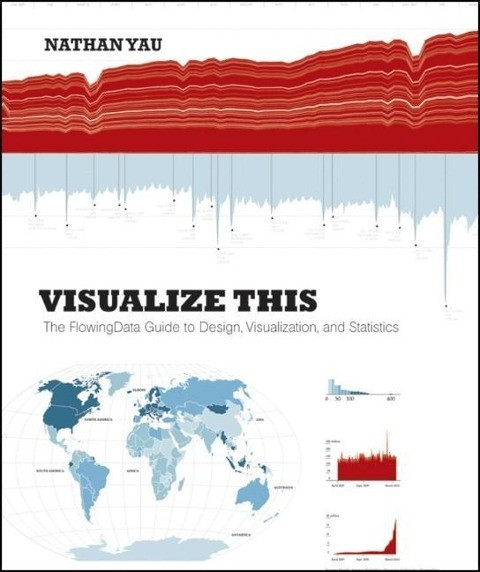
Visualize This
Kurzinformation
inkl. MwSt. Versandinformationen
Artikel zZt. nicht lieferbar
Artikel zZt. nicht lieferbar

Beschreibung
Practical data design tips from a data visualization expert of the modern age Data doesn't decrease; it is ever-increasing and can be overwhelming to organize in a way that makes sense to its intended audience. Wouldn't it be wonderful if we could actually visualize data in such a way that we could maximize its potential and tell a story in a clear, concise manner? Thanks to the creative genius of Nathan Yau, we can. With this full-color book, data visualization guru and author Nathan Yau uses step-by-step tutorials to show you how to visualize and tell stories with data. He explains how to gather, parse, and format data and then design high quality graphics that help you explore and present patterns, outliers, and relationships. * Presents a unique approach to visualizing and telling stories with data, from a data visualization expert and the creator of flowingdata.com, Nathan Yau * Offers step-by-step tutorials and practical design tips for creating statistical graphics, geographical maps, and information design to find meaning in the numbers * Details tools that can be used to visualize data-native graphics for the Web, such as ActionScript, Flash libraries, PHP, and JavaScript and tools to design graphics for print, such as R and Illustrator * Contains numerous examples and descriptions of patterns and outliers and explains how to show them Visualize This demonstrates how to explain data visually so that you can present your information in a way that is easy to understand and appealing. von Yau, Nathan
Produktdetails

So garantieren wir Dir zu jeder Zeit Premiumqualität.
Über den Autor
Nathan Yau is a PhD candidate in Statistics at UCLA and a lifelong data junkie. His goal is to make data available and useful to those who aren't necessarily data experts, and he focuses on data visualization and personal data collection. You can follow his visualization experiments at http://flowingdata.com.

- paperback
- 154 Seiten
- Erschienen 2017
- CreateSpace Independent Pub...
- paperback
- 277 Seiten
- Erschienen 2006
- MIT Press
![Basher Science: Planet Earth: What Planet Are You On? [With Poster] Basher Science: Planet Earth: What Planet Are You On? [With Poster]](https://d3k2uuz9r025mk.cloudfront.net/media/image/55/6e/ee/1717166233_633644401673.jpg)
- Taschenbuch
- 128 Seiten
- Erschienen 2010
- Kingfisher

- Hardcover
- 405 Seiten
- Erschienen 2010
- John Wiley & Sons Inc

- Hardcover
- 100 Seiten
- Erschienen 1981
- Sage Publications, Inc

- Gebunden
- 191 Seiten
- Erschienen 2013
- Springer

- Taschenbuch
- 288 Seiten
- Erschienen 2002
- Crc

- paperback
- 160 Seiten
- Erschienen 2024
- Corwin


